Interactive Answers, Not Just Text
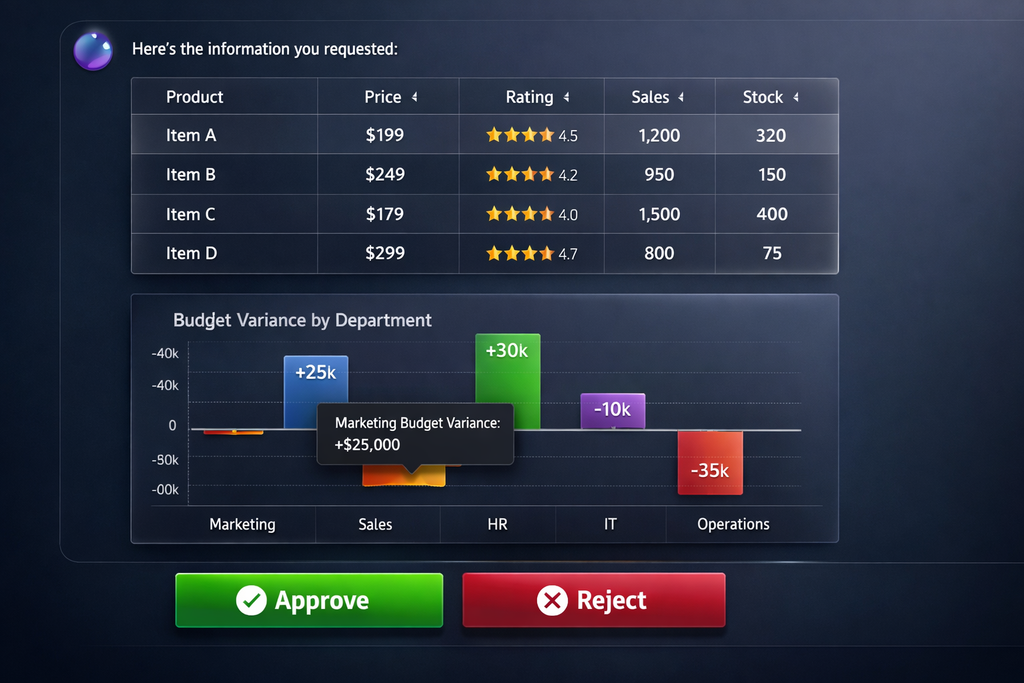
Why settle for paragraphs when you can interact with live data? A2UI (Agent-to-UI) enables Docmet's agents to dynamically generate custom UI components on demand—sortable tables, trend charts, approval workflows, and interactive dashboards rendered directly in the chat interface.
The Death of Plain Text Responses
Traditional chatbots return paragraphs. You read them, then you have to manually create the spreadsheet, draft the email, or update the report. The AI describes the work—you still do it.
🧠 Information Without Structure
Reading 3 paragraphs comparing 5 contracts requires mental parsing. A comparison table presents the same information instantly scannable. Text is inefficient for structured data.
🖱️Static, Not Dynamic
You can't sort text by a column, filter by criteria, or zoom into a time period. Text is passive. Enterprise users need to explore data, not just read about it.
✏️ You Do the Work
AI tells you "Budget variance in Q3 was +15% in Engineering, -8% in Marketing." Now you open Excel, create a chart, format it for your CFO. The AI didn't save you work—it just provided data.
⚠️ Dead-End Answers
AI identifies a compliance risk. Great. Now what? You copy the text, paste into email, manually route for approval. There's no workflow, no "click to escalate" button. Information without action is incomplete.
Generative UI: Interfaces, Not Just Text
A2UI doesn't just return information—it generates the exact interface you need to act on that information. Agents understand query intent and render the appropriate component automatically.
🎯 AI Chooses the Right Component
Ask "Compare Q3 vs Q4 budget" → Formatter Agent recognizes comparison intent → Generates `data-table` component. Ask "Show budget trend" → Recognizes temporal analysis → Generates `line-chart` component. The AI understands what interface fits the question.
⚡Real-Time Component Generation
Agents output JSON payloads that render as React components in real-time. No page refresh, no separate apps. The chat interface becomes a dynamic application that adapts to each query.
🖱️ Explore, Don't Just Read
Tables are sortable and filterable. Charts are zoomable with hover tooltips. Approval cards have clickable action buttons. You interact with live data, not static descriptions.
✅ From Insight to Action
AI detects a compliance risk → Generates an approval card with "Escalate to Legal" button → Click triggers workflow → Legal team gets notified with full context. The entire workflow happens in the chat.
Six Core Component Types
Docmet's formatter agent can generate any of these interactive components based on query intent and data structure.
📋 Sortable Comparison Tables
Use Case: Comparisons, lists, multi-attribute data. Features: Sortable columns (click header), filterable rows (search box), pagination (for 100+ rows), row highlighting, expandable details, export to CSV. Example Query: "Compare all vendor contracts by liability limit" → Table with columns: Vendor, Contract ID, Liability Cap, Expiration, Risk Score (sortable by any column).
📊 Visual Data Analysis
Types: Bar charts, line graphs, pie charts, area charts, scatter plots. Features: Interactive tooltips (hover for details), zoom/pan controls, legend toggle, time period selectors, export to PNG. Example Query: "Show engineering budget trend over last 4 quarters" → Line chart with Q1-Q4 on X-axis, budget $ on Y-axis, actual vs. planned as two lines.
✅ Decision Action Cards
Use Case: Requiring human authorization or escalation. Features: Action buttons (Approve/Reject/Escalate), reason text boxes, approval chains (shows who approved previously), audit trail. Example Query: "Flag this budget overage for VP approval" → Card showing budget details + "Approve Overage" (green) and "Reject & Revise" (red) buttons. Click logs decision.
📝 Procedural Guidance
Use Case: How-to queries, onboarding, compliance checklists. Features: Numbered steps, expandable details (click to show sub-steps), checkboxes for completion tracking, linked documents (click to open), estimated time per step. Example Query: "How do I onboard a new vendor?" → Interactive checklist: Step 1: Collect W9 (checkbox + link to form), Step 2: Legal review...
⚠️ Real-Time Risk Scoring
Use Case: Compliance monitoring, security alerts, audit results. Features: Color-coded risk levels (High=Red, Medium=Yellow, Low=Green), affected document counts, recommended actions, drill-down links. Example Query: "Show compliance risks in our data retention policies" → Dashboard: 3 High risks (red cards), 7 Medium (yellow), 12 Low (green). Click High risk to see details.
🕸️ Interactive Network Maps
Use Case: Relationship exploration, dependency analysis. Features: Zoomable/pannable network graph, node clicking (reveal details), relationship filtering, path highlighting. Example Query: "Show how Project Alpha connects to our budget" → Interactive graph: Budget node → FUNDS edge → Project Alpha → MANAGED_BY → Person nodes. Click nodes to expand.
Technical Architecture
The A2UI Generation Pipeline
Step 1: Intent Analysis
The Generator Agent (formatter node) receives:
- Original user query
- Retrieved & verified documents
- Query classification (comparison, trend, decision, how-to)
It analyzes the query structure to determine optimal component type:
function selectComponent(query: string, data: any): ComponentType {
if (query.includes('compare') || hasMultipleEntities(data)) {
return 'data-table';
}
if (query.includes('trend') || hasTimeSeriesData(data)) {
return 'chart';
}
if (query.includes('approve') || query.includes('flag')) {
return 'approval';
}
if (query.includes('how do i') || query.includes('steps')) {
return 'plan';
}
// ... more heuristics
}
Step 2: Data Transformation
The agent extracts structured data from retrieved documents:
Example: Contract comparison query retrieves 3 PDFs → Agent extracts:
{
"contracts": [
{ "vendor": "Acme Corp", "liability": "Unlimited", "expires": "2025-12-31", "risk": "High" },
{ "vendor": "TechCo", "liability": "$5M cap", "expires": "2026-06-30", "risk": "Medium" },
{ "vendor": "GlobalServices", "liability": "$1M cap", "expires": "2025-03-15", "risk": "Low" }
]
}
Step 3: JSON Payload Generation
The agent outputs a JSON payload conforming to the component schema:
{
"type": "data-table",
"title": "Vendor Contract Liability Comparison",
"columns": [
{ "key": "vendor", "label": "Vendor Name", "sortable": true },
{ "key": "liability", "label": "Liability Cap", "sortable": true },
{ "key": "expires", "label": "Expiration", "sortable": true, "type": "date" },
{ "key": "risk", "label": "Risk Level", "sortable": true, "renderAs": "badge" }
],
"data": [
{ "vendor": "Acme Corp", "liability": "Unlimited", "expires": "2025-12-31", "risk": "High" },
{ "vendor": "TechCo", "liability": "$5M cap", "expires": "2026-06-30", "risk": "Medium" },
{ "vendor": "GlobalServices", "liability": "$1M cap", "expires": "2025-03-15", "risk": "Low" }
],
"sortable": true,
"filterable": true,
"exportable": true,
"defaultSort": { "column": "risk", "direction": "desc" }
}
Step 4: React Component Rendering
The chat frontend receives the JSON and dynamically renders the appropriate React component:
function renderA2UIComponent(payload: A2UIPayload) {
switch (payload.type) {
case 'data-table':
return <InteractiveTable {...payload} />;
case 'chart':
return <ResponsiveChart {...payload} />;
case 'approval':
return <ApprovalCard {...payload} />;
case 'plan':
return <StepByStepPlan {...payload} />;
// ... more component types
}
}
The component is fully interactive, with sorting/filtering/actions handled client-side.
Step 5: Action Handling
When users interact with components (click "Approve" button, sort table), actions are:
- Captured by the React component
- Sent to backend API (if action requires server logic)
- Logged in audit trail
- Response rendered (e.g., "Approval sent to VP of Finance")

A2UI in Practice
From Query to Outcome in Seconds
⚖️ Multi-Contract Comparison Table
Query: "Compare indemnity clauses in our top 5 vendor contracts." A2UI Response: Interactive table with columns: Vendor, Clause Text (truncated, expandable), Liability Limit, Risk Score, Contract PDF Link. User clicks column headers to sort by risk, clicks "View Full Clause" to expand text, exports to Excel for legal team review. Outcome: 30 minutes of manual work reduced to 30 seconds of interaction.
💰 Variance Chart + Drill-Down
Query: "Show Q3 vs Q4 budget variance by department." A2UI Response: Bar chart showing each department with actual vs. planned bars. User hovers over Engineering bar → tooltip shows +$450K variance. User clicks bar → Drills down to line-item table showing which projects caused overage. Outcome: CFO gets instant visual answer + ability to investigate root causes without leaving chat.
✅ Risk Escalation Card
Query: "This vendor contract has unlimited liability—flag for legal review." A2UI Response: Approval card showing contract details, risk explanation, and two buttons: "Escalate to Legal" (sends Slack notification to legal team with contract attached) and "Waive Risk" (requires justification text box). User clicks Escalate → Legal gets notified instantly with full context. Outcome: Manual email routing eliminated, audit trail automatic.
🎓 Interactive Step-by-Step Checklist
Query: "How do I set up a new employee in our systems?" A2UI Response: Step-by-step plan component with 8 steps: (1) Create AD account (checkbox + link to AD console), (2) Request laptop (checkbox + link to IT ticket), (3) Enroll in benefits (checkbox + link to HR portal)... User checks off steps as completed, progress bar updates. Outcome: New HR coordinator completes onboarding 2x faster with zero training.
A2UI Design Philosophy
Our Design Principles
1. Progressive Disclosure
Don't overwhelm users. Start with summary view, allow drill-down into details.
- Table: First 10 rows visible, "Load More" for pagination
- Chart: Default to last 3 months, date selector for full history
- Plan: Steps collapsed by default, click to expand sub-tasks
2. Accessibility First
All components meet WCAG 2.1 AA standards:
- Keyboard navigation (tab through table rows, arrow keys for charts)
- Screen reader support (ARIA labels on all interactive elements)
- High contrast mode (readable in light/dark themes)
- Focus indicators (clear visual feedback for keyboard users)
3. Mobile Responsive
Components adapt to screen size:
- Desktop: Full-width tables with all columns
- Tablet: Horizontal scroll for wide tables
- Mobile: Card-based view (tables become stacked cards)
4. Performance Optimized
Large datasets don't freeze the UI:
- Virtualization: Tables render only visible rows (handles 10k+ row datasets)
- Lazy Loading: Charts load data progressively
- Debouncing: Sort/filter actions debounced to prevent excessive re-renders
5. Consistent Styling
All components share design system:
- Colors: Brand blue for primary actions, red for destructive, green for success
- Typography: Inter font family, clear hierarchy (headings 18px, body 14px)
- Spacing: 8px grid system for consistent padding/margins
- Shadows: Subtle elevation for cards (4px blur for depth)
Tailored to Your Brand
White-Label Component Library
🎨 Your Color Palette
Enterprise customers can configure component colors to match corporate brand guidelines. Set primary, secondary, success, warning, danger colors. All charts and buttons adapt automatically.
🏷️ Branded Exports
When users export tables to Excel or charts to PNG, your company logo and watermark are automatically added. Perfect for client-facing reports.
🛠️ Build Your Own Components
Enterprise plan includes custom component development. Need a specialized "Contract Clause Heatmap"? Our team builds it as a new component type. Future queries can generate it automatically.
🔗 Connect to Your Workflows
Approval buttons can trigger custom webhooks to your internal systems (Salesforce, SAP, ServiceNow). "Approve Budget" button can auto-create a PO in your ERP.
A2UI Drives Better Outcomes
Metrics comparing A2UI vs. text-only responses
Faster Task Completion
Interactive components vs. reading text
Higher User Engagement
Users interact with A2UI components vs. plain text
User Preference Rate
Prefer A2UI over text-only answers
Reduction in Follow-Up Questions
Interactive components answer implicit questions
Based on A/B testing with 2,000+ enterprise users across Legal, Finance, and HR departments (Q4 2025)
Implementation Details
Technical Stack
Frontend
- React 18: Component-based UI framework
- TypeScript: Type-safe component props
- Tailwind CSS: Utility-first styling
- Recharts: Chart library for data visualizations
- TanStack Table: High-performance table component
Component Libraries
- shadcn/ui: Base component primitives
- Radix UI: Accessible component foundations
- Lucide Icons: Icon library
Backend
- JSON Schema Validation: Ensures component payloads are well-formed
- React Server Components: Optional for SSR performance
Browser Support
- Chrome 90+
- Safari 14+
- Firefox 88+
- Edge 90+
Example Component Schema:
interface DataTablePayload {
type: 'data-table';
title: string;
columns: Array<{
key: string;
label: string;
sortable?: boolean;
filterable?: boolean;
type?: 'string' | 'number' | 'date' | 'badge';
renderAs?: 'text' | 'link' | 'badge' | 'currency';
}>;
data: Array<Record<string, any>>;
sortable?: boolean;
filterable?: boolean;
exportable?: boolean;
defaultSort?: { column: string; direction: 'asc' | 'desc' };
actions?: Array<{ label: string; handler: string }>;
}
Why Interactive Components Win
A2UI vs. Text-Only Chatbots
A2UI Across the Platform
Powered by the Full Stack
See the Difference Interactive AI Makes
Experience how A2UI transforms enterprise knowledge work. Watch your data come alive with sortable tables, dynamic charts, and actionable workflows—all generated automatically.